Introduction: Post-mortem Analysis of Coatings — Let It Tell Us "How It Died"
"Post-mortem" (Failure Analysis) of coating failure is the work in the coatings industry that most enhances technical capability—through the combined application of the five major analytical methods FTIR/DSC/SEM/EDS/EIS—to reverse-engineer the complete chemical/physical degradation chain of the coating from "healthy state" to "failed state". Every failure case is a practical record of a "Failure Mode and Effects Analysis" (FMEA)—distilling the lessons of individual cases into universal principles for design and construction improvement—and is a key practice for coating engineers to leap from "experience-based" to "scientific diagnostic" proficiency.
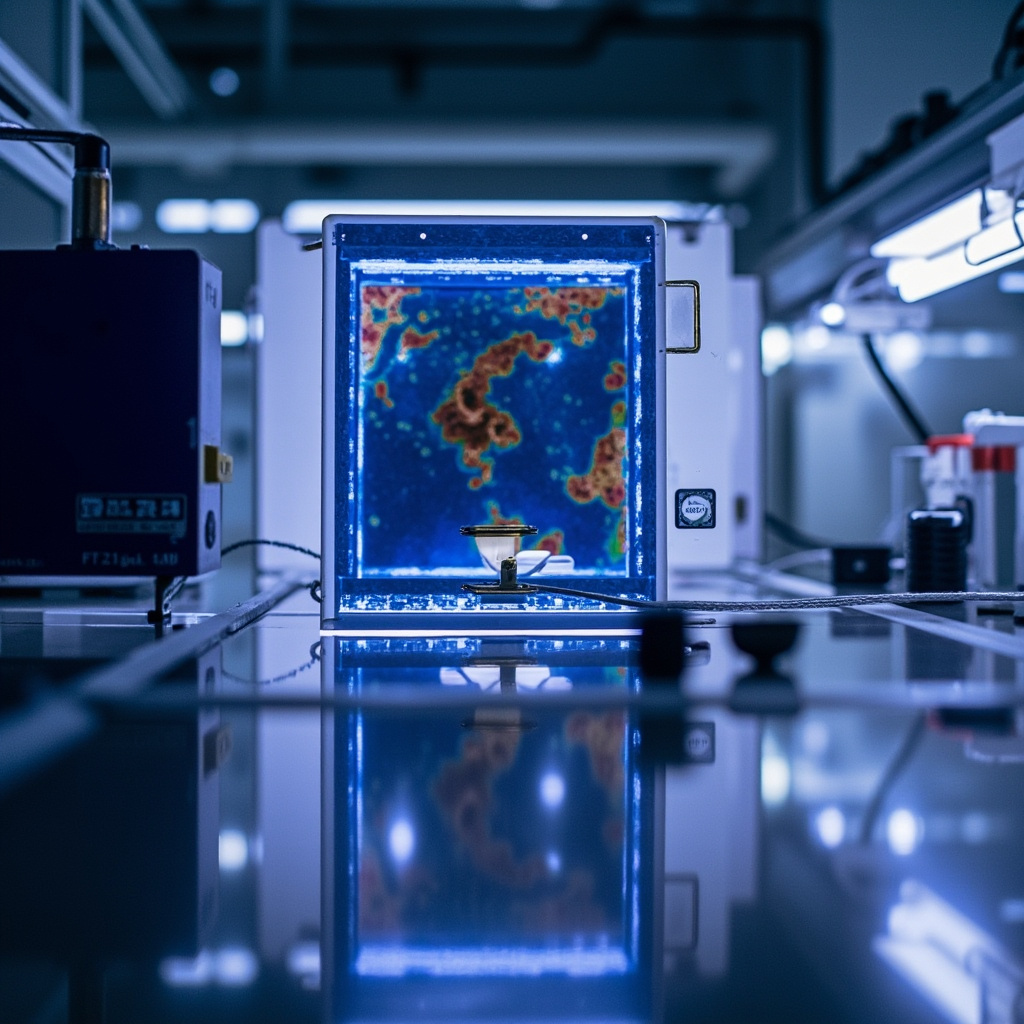
Coating failure analysis is a systems engineering method that employs various instrumental analysis techniques to conduct multi-dimensional comprehensive diagnosis of failed coatings in terms of chemical composition, microscopic morphology, thermodynamic properties, and electrochemical characteristics, so as to determine the root cause and propose improvement solutions.
I. Functional Positioning and Applicable Failure Types of the Five Major Analytical Methods
| Analytical Method | Core Function | Detection Range | Applicable Failure Types | Sample Requirements | Cost (RMB/sample) |
|---|---|---|---|---|---|
| FTIR | Resin chemical structure/degradation product identification | Molecular functional groups (4000-400 cm⁻¹) | Chalking/gloss loss/chemical degradation | >1 mg (ATR mode/trace) | 200-500 |
| DSC | Tg/degree of cure/residual reaction heat | -50~+300°C | Under-curing/coating embrittlement | 5-10 mg (sealed crucible) | 300-800 |
| SEM | Micro-morphology/interface/cross-section | >1000× magnification | Blistering interface/interlayer delamination/pinholes | 1 cm² (coating + substrate/polished cross-section) | 500-1500 |
| EDS | Elemental composition/corrosion products/contaminants | B-U (>0.1% wt) | Salt contamination/corrosion products/oil stains | Same as SEM (EDS is an attachment of SEM) | 200-500 (attachment) |
| EIS | Coating impedance/interface corrosion state | 0.01 Hz-100 kHz | Hidden corrosion under coating/immersion lifetime prediction | >10 cm² (coating + substrate/non-destructive) | 500-2000 |

II. Diagnostic Practice on Five Typical Failure Cases
Case 1: Blistering of Epoxy Zinc-Rich Primer — Combined EDS + SEM Diagnosis
Cross-sectional SEM of the blistering area shows — high concentration of Cl (>200mg/m²) + Na elements detected by EDS at the coating/steel substrate interface — confirming the root cause of blistering as osmotic blistering mechanism due to excessive salt residue on substrate after sandblasting (ISO 8502-6). Corresponding remediation — enforce salt detection after sandblasting (all surfaces <50mg/m²) and final rinse with deionized water.
Case 2: Chalking of PU topcoat — Combined FTIR + DSC
FTIR detected a >50% decrease in the intensity of the urethane bond (-NH-CO-O-) peak (1730 cm⁻¹) on the coating surface and the appearance of a new -COOH peak (1710 cm⁻¹)—indicating that photo-oxidation is the chemical root cause of chalking. DSC detected a decrease in Tg from the designed +60°C to +35°C—confirming that the resin molecular weight decreased due to chain scission.

Technical deepening: systematic optimization methods for process parameters (DOE experimental design)
The optimization of coating production processes should not rely on the "trial-and-error method" but should adopt the scientific method of DOE experimental design. Taking the dispersion process as an example—factors affecting quality (linear velocity/time/filling rate/temperature), 4 factors each at 3 levels—a full factorial requires 81 experiments—DOE uses orthogonal experiments L9 (9 times) or response surface methodology (27 times) to greatly reduce the number of experiments—while obtaining the main effects and interactions of each factor. For example, it is found that "the interaction of linear velocity × time is significant"—high linear velocity + short time and low linear velocity + long time can achieve the same dispersion effect—but the former saves energy by >20%.
In DOE analysis, interpretation of the P-value — P95% confidence). The final output of DOE is a set of predictive models (polynomial regression equations) — input line speed/time/temperature → predict fineness/viscosity/gloss — providing formulation engineers with a "digital formulation optimization" tool.
Industry practice: from "master craftsman's feel" to "parameter standardization"
The common challenge in the coatings industry — when experienced veteran workers retire, their "feel" (mixing resistance / fineness gauge drawdown / visual inspection of wet-film gloss) is taken away — new employees cannot replicate it. Transform the "feel" into quantifiable standard parameters (1) mixing resistance → viscometer reading; (2) fineness gauge drawdown → fineness gauge reading (μm); (3) wet-film gloss → gloss meter (GU value). The "standard parameter card" for each process is posted next to the equipment — new employees operate according to the "card" rather than "by feel". "Parameter standardization" is a key step for a coatings factory to move from "workshop" to "factory".
FAQ
Q1: How does EIS (Electrochemical Impedance Spectroscopy) assess corrosion under coatings without damaging the coating?The measurement principle of EIS—applying a small sinusoidal AC perturbation voltage (±10mV) on the coating surface to measure the modulus of impedance (|Z|) and phase angle (φ). The |Z| value in the low-frequency region (0.01Hz) reflects the total impedance of the coating (coating itself + interface)>10⁹Ω·cm² = excellent; 10⁷-10⁹ = good; 10⁵-10⁷ = coating has degraded but steel substrate shows no obvious corrosion; <10⁵ = steel under the coating is undergoing active corrosion.
Q2: Why is ATR mode used in FTIR analysis of coating chalking?ATR (Attenuated Total Reflection) mode—infrared light undergoes total internal reflection within the ATR crystal (diamond/Ge)—penetrates the coating surface to a depth of only 1-2 μm, selectively detecting chemical changes in the topmost surface of the coating (chalking begins first at the surface)—this is a "surface analysis" mode far superior to transmission mode (which requires scraping the entire coating layer into powder/KBr pellet pressing—information is diluted by undegraded deep-layer resin).
Q3: The choice between "cold mounting" and "hot mounting" in SEM cross-section analysis?Cold mounting (epoxy cold mounting/room temperature curing)——zero thermal impact on the coating——the coating/substrate interface will not be damaged by thermal stress——this is the reason why cold mounting must be used for coating failure analysis. Hot mounting (phenolic resin/180°C/20MPa)——high temperature + high pressure will destroy the original appearance of the coating (coatings below Tg remelt and undergo rheological flow at 180°C)——the failure interface is masked——must never be used.
Q4: How to select the Equivalent Circuit model for EIS data?The most commonly used coating EIS equivalent circuit is Rs(RcQc)(RctQdl)Rs = solution resistance, Rc = coating resistance, Qc = coating capacitance (CPE), Rct = charge transfer resistance (interface corrosion rate), Qdl = double layer capacitance. When Rc < 10⁶ Ω·cm² and Rct < 10⁵ Ω·cm² — the coating has failed; when Rc > 10⁹ — the coating is intact. Fitting of the equivalent circuit model requires dedicated EIS fitting software (such as ZView/ZSimpWin).
Q5: Is a single method insufficient for the "chain of evidence" in coating failure analysis?Typical case—FTIR alone finds resin degradation—but is the degradation the "cause" or the "effect"?—It may be that salts on the substrate first cause blistering → coating rupture → UV and moisture intrude into the coating interior → resin degrades at the cracks—but FTIR only detects the final degradation products and cannot see the initial event of "salts → blistering". A complete failure analysis requires multi-method cross-validation: SEM for morphology, EDS for elements, FTIR for chemistry, EIS for electrochemistry—building a complete causal chain of evidence from root cause to final failure mode.
Q6: Does "unrepresentative" sampling in coating failure analysis lead to misdiagnosis?Sampling of failed coatings must be taken from the failure center zone + edge transition zone + intact unfailed zone—compare and analyze the differences among the three—the difference gradient indicates the spatial propagation direction and root cause location of the failure. Sampling only from the most severely failed zone (most convenient)—can only see the "final result" but not the "root cause," misleading the diagnosis.
Q7: Detection limit and accuracy of EDS elemental analysis?The detection limit of EDS is approximately 0.1%wt (1000ppm). For extremely low-concentration salt contamination (e.g., 20mg/m² NaCl—concentration below 0.01%wt at a coating thickness of 100μm), EDS cannot detect it and a more sensitive method is required—ion chromatography (IC/detection limit <1ppm)—where salts are eluted and dissolved from the coating surface before injection. EDS and IC are complementary rather than substitutive in salt analysis.
Q8: The "Micro-CT" new technology for coating failure analysis?X-ray Micro-CT (resolution <1μm) can perform three-dimensional non-destructive scanning of coatings to reconstruct the 3D spatial distribution of pores, bubbles, cracks, and corrosion products within the coating—more comprehensive than the single cross-section information of SEM. Micro-CT is a new tool in the field of coating failure analysis—the equipment is expensive (>5 million RMB)—but its ability to provide three-dimensional information is incomparable to that of SEM (two-dimensional).
Q9: How to translate failure analysis conclusions into "design improvements"? The analysis conclusion of each failure case must be organized into the FMEA format of "failure mode → effect → cause → improvement measure" and stored in the enterprise's failure case knowledge base—for reference in future formulation design and construction plans. The cost of a single failure analysis (several thousand to tens of thousands of yuan) yields an ROI > 10x when converted into the benefit of "avoiding similar future failures."
Q10: The "time cost" of coating failure analysis — rapid diagnosis vs. comprehensive analysis in emergencies?In emergencies (e.g., customer complaints + production line awaiting resolution) — a preliminary diagnosis can be provided within 24-48h using a combination of FTIR + SEM + EDS — indicating the most likely root cause (90% confidence) — and providing a temporary remediation plan. A comprehensive multi-technique + multi-validation analysis — requires 1-4 weeks for in-depth investigation and new formulation development decisions. The trade-off between timeliness and depth in failure analysis is a "management judgment" rather than merely a technical one.
FAQ: In-Depth Technical Q&A Supplement
Q11: How do the differences in domestic and international standards for this technology affect product export?Domestic standards (GB) differ from ISO/ASTM standards in test methods and acceptance criteria. For example, salt spray testing—GB/T 1771 (equivalent to ISO 7253) has test conditions basically consistent with ASTM B117—but the rating systems (ISO 4628 vs ASTM D610/D714) differ—when providing test reports for exported products, you must simultaneously indicate the corresponding international standards, otherwise overseas customers cannot make a comparative assessment. It is recommended to list both GB and ISO/ASTM dual-standard indicators in the TDS (Technical Data Sheet) of exported products—to enhance the trust of international customers.
Q12: How to verify the long-term service performance of this technology in actual engineering?Laboratory accelerated testing (salt spray/QUV/cyclic corrosion) provides comparative data—but cannot fully replace actual outdoor exposure testing. Recommendations—(1) Set up outdoor exposure racks at both the factory location and typical customer locations (e.g., coastal C5-M/industrial C4)—conduct annual inspections of coating appearance/adhesion/film thickness changes—establish a company-owned outdoor service database; (2) Collaborate with universities/research institutes—combine enterprise data with academic research—enhance data credibility.
Q13: What should SMEs pay attention to when purchasing related raw materials/equipment?(1) The batch stability of suppliers is more important than unit price—it is recommended to require suppliers to provide COA data for >10 batches—and evaluate batch variation (CpK); (2) For equipment procurement, visit peers who have used the equipment for >2 years to understand the long-term reliability and after-sales service quality of the equipment—rather than relying only on the demonstration data from equipment suppliers; (3) For key raw materials (resin/curing agent)—maintain at least 2 qualified suppliers to guard against single-supply risk.
Q14: What is the current state and trend of digital transformation in this field?The digital transformation of the coatings industry is evolving from “point-based applications” (automation of individual equipment/processes) to ”system integration” (full-chain ERP+MES+PMS). Currently, the digitalization of small and medium-sized coatings factories has the ”highest ROI investment” in automatic batching systems + digitalization of quality control data — with a payback period of 1-3 years — which is the prioritized recommended direction. Future trend — AI + sensors enabling real-time optimization of process parameters — further reducing quality fluctuations between batches.
Q15: How can a newly entered coating engineer quickly master this technology?(1)Combine theory and practiceDo not only read literature without touching actual production—nor rely solely on experience without learning theory;(2)Establish a “failure case archive”Every customer complaint/production anomaly/coating failure—record the root cause and resolution process—this is the most effective learning material;(3)Learn from suppliersTechnical personnel from resin/additive/pigment suppliers are the carriers of ”tacit knowledge” in this field—communicate more with them about solutions to specific problems.
Engineering Application and Implementation Recommendations
Pre-construction preparation and risk assessment
Before formal construction, the three prerequisite tasks must be completed: (1) Substrate condition confirmation — inspect the moisture content of the substrate (concrete <4% / steel with no visible water film), surface treatment grade (sandblasting Sa2.5 / manual St3), and salt contamination (chlorides dew point +3°C) — construction may proceed only when all three are satisfied — if any item exceeds the limit, irreversible defects will occur during coating curing; (3) Coating batch verification — verify the coating batch number, production date, and COA test report — confirm that the coating is within its shelf life and that key indicators (viscosity / fineness / curing time) meet requirements.
Key control points during the construction process
During construction, it is necessary to continuously monitor and record the following parameters: (1) Wet film thickness (WFT) of each coat (wet film thickness gauge / at least 5 points per 10m²) — the conversion relationship between WFT and target dry film thickness (DFT) is DFT = WFT × volume solids (%) — adjust spraying parameters immediately if WFT deviation is found; (2) Drying/curing time of each coat — epoxy system requires surface dry (2-4h/23°C) → hard dry (6-12h) → full cure (7 days) — the application of the next coat must be within the optimal recoat window of the previous coat (usually 4-24h after surface dry) — recoating too early → interlayer solvent penetration and lifting/ recoating too late → reduced interlayer adhesion; (3) Continuous recording of construction environmental conditions — record temperature/humidity/dew point every 2h — archived as part of the completion documentation.
Quality Acceptance and Completion Documentation
The final acceptance of the coating system shall be based on the acceptance criteria specified in the contract (e.g., ISO 12944 / SSPC-PA 2 / GB 50205) — key acceptance items include: (1) Dry film thickness (DFT / ≥5 points per 10m² / any single point ≥80% of nominal value / average within 100–120% of nominal value); (2) Holidays detection (wet sponge method for DFT 500μm / zero holidays); (3) Adhesion (pull-off method ISO 4624 / ≥ design value / failure mode preferably cohesive failure); (4) Visual inspection (no sagging / no orange peel / no particles / uniform gloss). All acceptance test data shall be compiled into as-built documentation including test reports + construction records + paint batch numbers + environmental records — serving as the data baseline for the 25-year warranty period of the coating system — with an archival period of ≥5 years.
Related Reading
Summary
The five-step diagnostic method for coating failure analysis—FTIR (chemical/surface), DSC (thermal/curing), SEM (morphology/interface), EDS (elemental/contamination), and EIS (electrochemical/non-destructive)—each has its specific focus, and their combined use can construct a complete evidence chain of failure. SEM cross-section analysis must use cold mounting (to avoid thermal damage). Kexin New Materials provides customers with full-spectrum coating failure analysis services and improvement solutions.