Introduction: Patents — the Strategic Map of Technological Competition in the Coatings Industry
The global coatings industry invests over USD 15 billion in R&D annually, with more than 150,000 patent applications filed each year. PPG (6,000+ active patents, >400 added annually), AkzoNobel (5,000+), and BASF (2,000+) — the three giants each invest over USD 200–500 million in patents per year. Chinese coatings companies already account for over 55% of global patent filings, yet their overseas布局 is below 5%, high-value core patents are under 10%, and the gap with multinational giants remains significant.
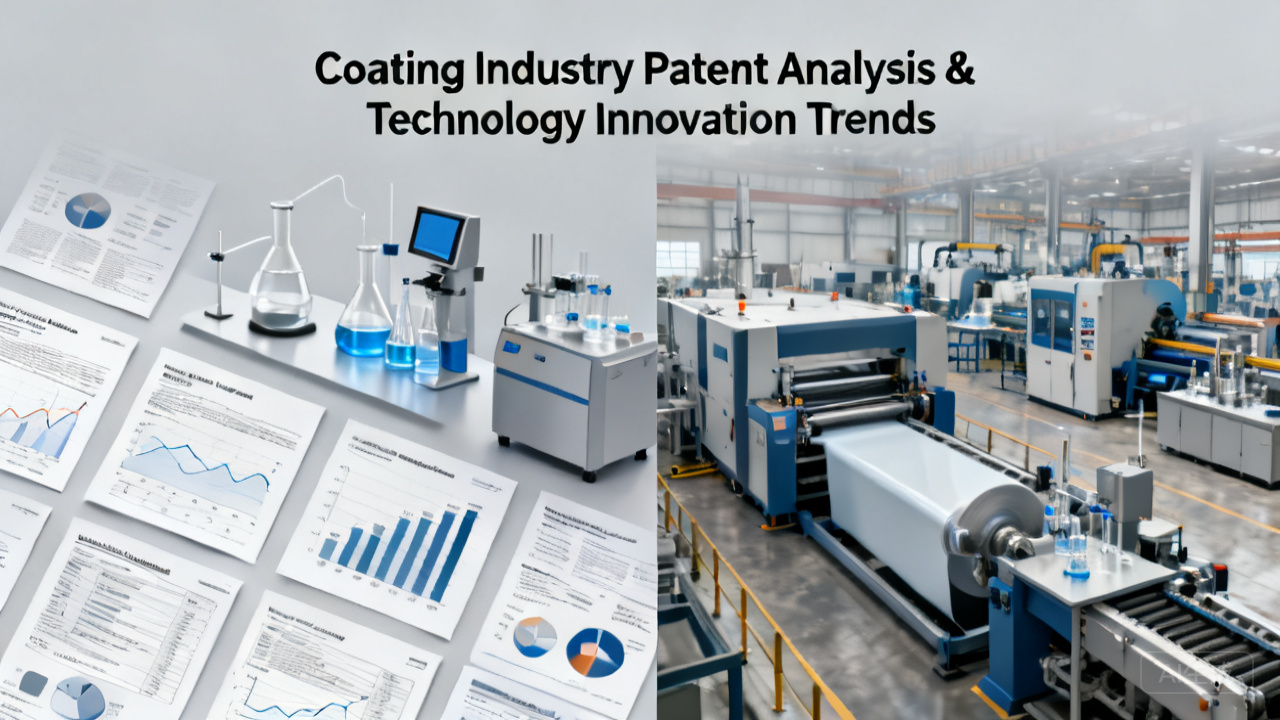
Patent analysis in the coatings industry through systematic retrieval, classification, and competitive landscape assessment—mapping technology development trends and the layout of core competitive entities—provides data-driven strategic intelligence for corporate R&D strategy and intellectual property protection.
I. Five Major Technology Innovation Hotspots (2015–2025)
| Technology Direction | Patent Annual Growth Rate | Representative Technologies | Major Deploying Enterprises | Commercialization Stage |
|---|---|---|---|---|
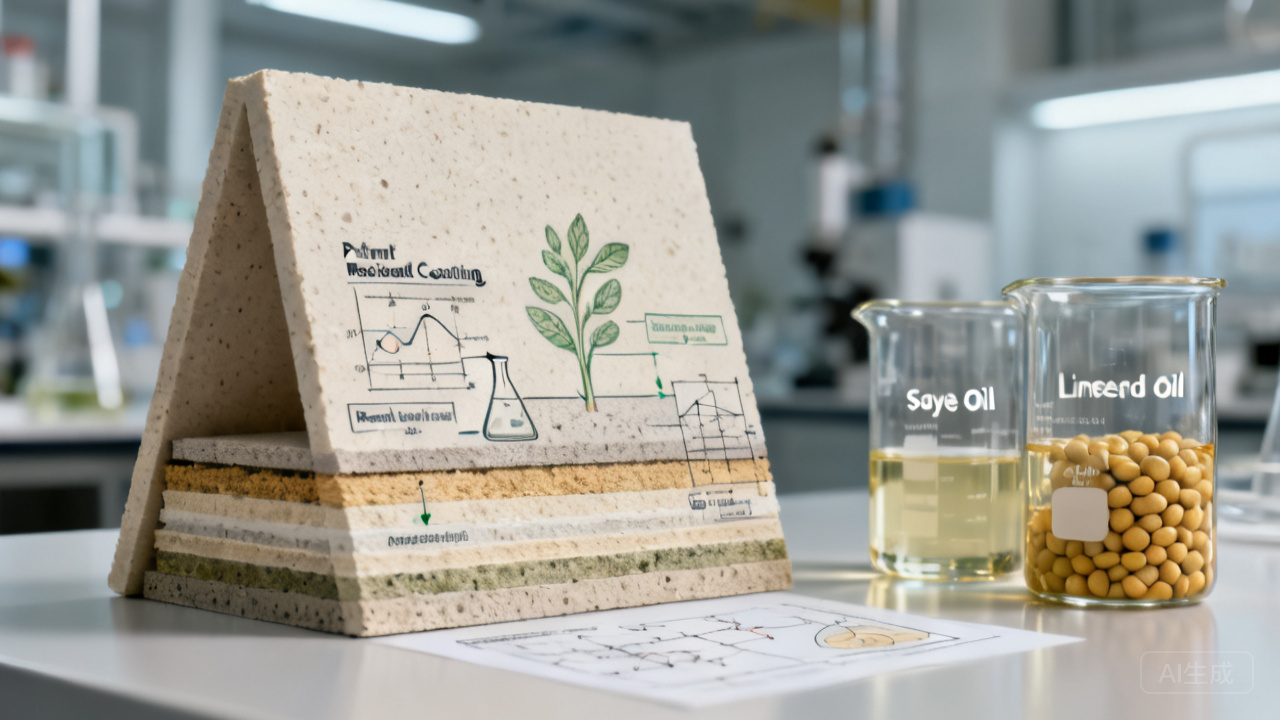
| Bio-based Coatings | >20% | Soybean oil alkyd/castor oil PU/lignin epoxy | PPG/AkzoNobel/Carpoly | Early Commercialization |
| Water-based/Solvent-free | 12-15% | Water-based epoxy/PU/UV/high-solid/powder | Whole industry | Mature—Expanding |
| Nano Functional Coatings | 15-18% | Self-cleaning TiO2/superhydrophobic SiO2/self-healing capsules | PPG/BASF/CAS | Mid-to-late Commercialization |
| Smart Coatings | >30% | Thermochromic/photochromic/electrochromic/sensing | PPG/US Military | Laboratory Stage |
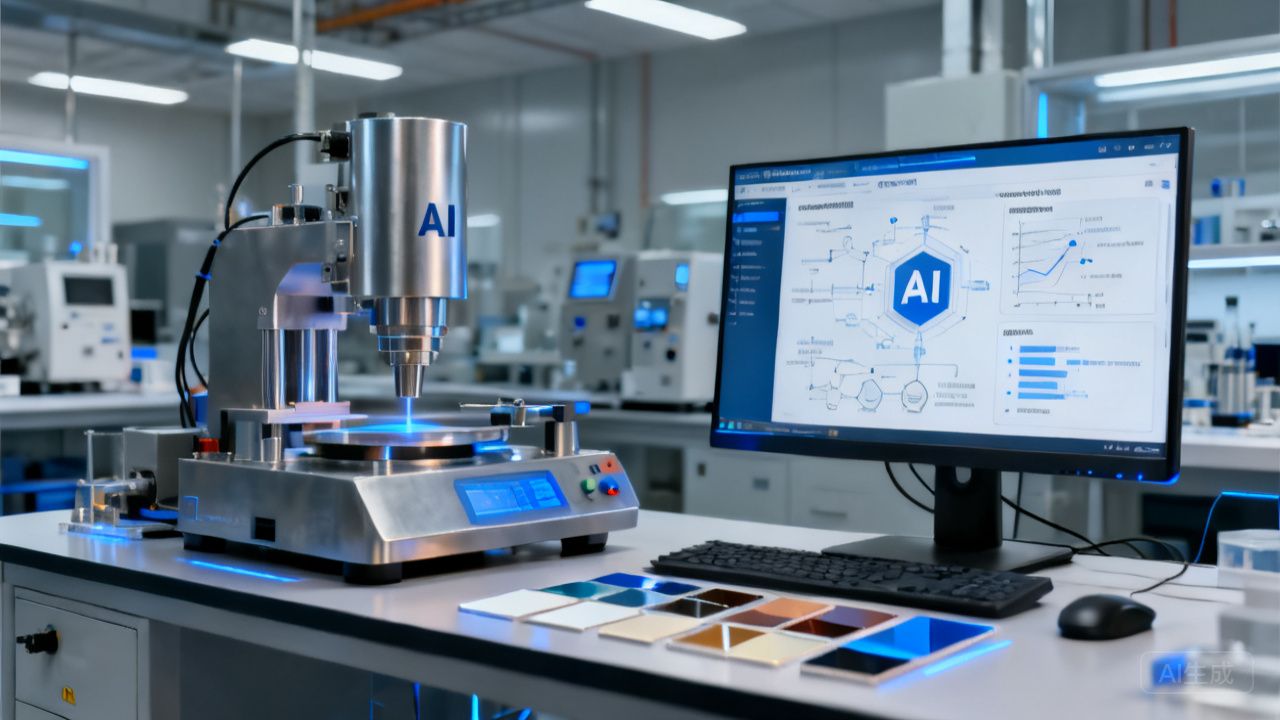
| AI/Digital Formulation | >25% | Machine learning performance prediction/AI color matching/robotic R&D | PPG/BASF/tech giants | Early Internal Tools |
FAQ
Q1: What substantive guidance can a patent map provide?(a) Identify technology gaps — Area A with dense enterprise presence / Area B with enterprise absence = follow-up or acquisition opportunities; (b) Predict competitive direction — where rivals' patents have shifted in the past 3-5 years → strategic early warning; (c) Assess own innovation strength — patents concentrated in weak or obsolete technologies → early warning that a shift is needed.
Q2: Bio-based coating patents are growing rapidly—why does market share remain <3%?Three barriers: cost (bio-based polyol >1.5-3x petrochemical), performance (low Tg/insufficient water resistance), certification chaos (no unified international standard). Long term—EU CBAM carbon tariff will change cost calculations—bio-based will gain regulation-driven competitiveness.
Q3: How to break the "large quantity but low quality" pattern of Chinese coating patents?Enhance overseas layout (current <5% → target >20%); increase PCT international applications; shift from "utility models" to "invention patents"; jointly file applications with downstream customers (automotive OEMs / new energy) to form an industry-chain patent pool.
Related Reading
Summary
The five major directions in coating technology—bio-based, waterborne, nano, smart, and AI—are each at different stages of maturity. China leads in patent quantity but lacks core high-value patents. A patent map serves as R&D GPS and competitive radar. Kexin New Materials leverages patent trends to guide formulation development—keeping products at the forefront.