Introduction: The "Carbon Identity" of a Bucket of Coating — The Carbon Journey from Crude Oil Extraction to the Factory Gate
A 20kg bucket of epoxy zinc-rich primer—from crude oil extraction (petroleum → naphtha → bisphenol A → epoxy resin) → titanium dioxide (TiO₂/ilmenite mining → chlorination → rutile type) → zinc dust (zinc ore → smelting → atomization) → solvent (naphtha → xylene) → electricity (factory dispersion/grinding/filling/power emission factor)—emits approximately 50-80kg CO₂eq in the full supply chain's “Cradle-to-Gate” (Cradle-to-Gate/from raw material extraction to factory exit). These carbon emissions are Scope 3 upstream emissions; the coating factory itself ”cannot see” them, yet they account for >90% of the coating product's carbon footprint. ISO 14067 and EU PEF (Product Environmental Footprint) are the international standards for coating product carbon footprint accounting, quantifying the full supply chain's carbon emissions into a single number (gCO₂eq/kg coating), providing the data foundation for carbon labeling (consumer side) and carbon trading (supply chain side).
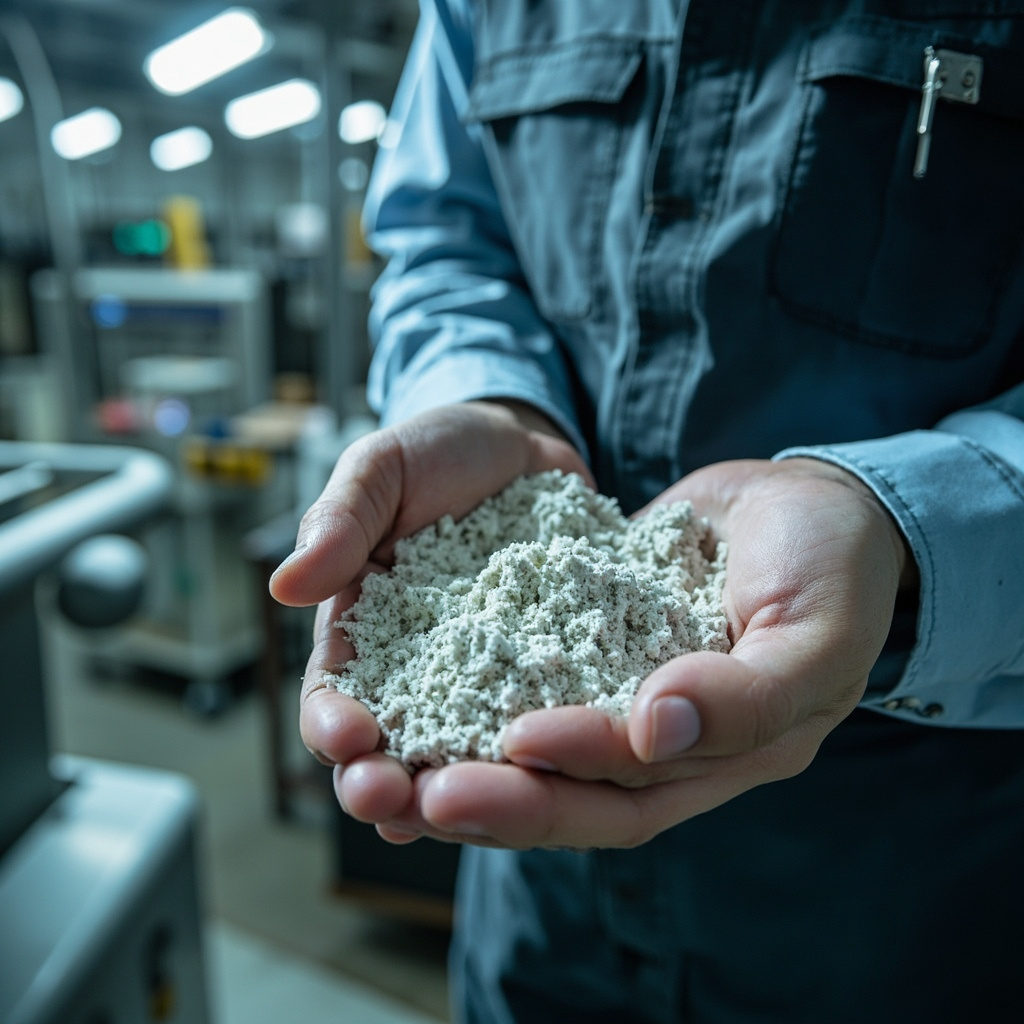
I. Four Major Contributors to the Carbon Footprint of Coating Products (Cradle-to-Gate / Typical Epoxy Coatings)
| Contribution Source | Carbon Emission (kgCO₂eq/kg coating) | Proportion (%) | Accounting Difficulty |
|---|---|---|---|
| Epoxy resin (bisphenol A type / liquid) | 5-7 (upstream raw materials + synthesis) | 35-50 | Carbon emission factors of upstream bisphenol A / ECH vary greatly (±30%) across different processes (ion exchange / sulfuric acid method) |
| Titanium dioxide (TiO₂ / rutile type) | 4-8 (chloride process) / 6-12 (sulfate process) | 25-40 | Sulfate-process TiO₂ emits >50% more carbon than chloride process (high energy consumption for sulfuric acid regeneration) |
| Zinc powder (Zn / spherical / >98%) | 2-4 | 10-20 | High energy consumption of zinc ore mining + smelting (hydrometallurgy / electrowinning) |
| Manufacturing process (electricity / dispersion / grinding / filling) | 0.5-2 (depending on electricity emission factor) | 5-15 | China's grid emission factor (>0.5kgCO₂/kWh) is much higher than Europe's (<0.3) — this is an important reason why the carbon footprint of coatings made in China is relatively high |
FAQ
Q1: What are the core differences between ISO 14067 and EU PEF?ISO 14067single environmental indicator (carbon emissions / Climate Change)has a relatively simple accounting method—suitable for companies starting with carbon footprint. PEF>16 environmental indicators (carbon emissions + water resources + acidification + eutrophication + ozone depletion + …)multi-dimensional—suitable for comprehensive product environmental declarations—data and calculation complexity is >10 times that of ISO 14067. Coatings companies usually start with ISO 14067—and transition to PEF after maturing.
Q2: How to choose between "Global (GLO)" and "Europe (RER)" data for the "Emission Factor" (EF) in the Ecoinvent v3 database?GLO——Global average data (including China's inefficient processes)——EF value is higher. RER——European advanced processes——EF value is lower. For the carbon footprint accounting of Chinese coating enterprises——(1)Prioritize the use of local Chinese emission factors (China Life Cycle Database CLCD/Sichuan University)Ecoinvent's GLO and RER are only "second-best alternatives"; (2) If using Ecoinvent——in the report's DQR (Data Quality Rating) table, mark "Geographical representativeness = Poor" (since the EF is non-Chinese data)——compliance auditors will pay attention to this point.
Q3: The "Allocation" issue in carbon footprint accounting — a resin factory produces epoxy resin + by-products (wastewater/slag) — how is carbon emissions allocated to the main product?ISO 14067 requires — (1) Priority use of physical allocation (mass/volume) — allocate carbon emissions to each product by mass proportion; (2) When physical allocation is infeasible — use economic allocation (allocate by the economic value proportion of each product) — economic allocation is most commonly used in the chemical industry — because the value of by-products is far lower than the main product (less than 5%) — allocating by value makes the main product's carbon emission share >95%. The choice of allocation method affects results by >10% — it must be explicitly stated and justified in the report.
Q4: What is the certification process for the Carbon Label (CN mark/UK Carbon Label)?(1) Entrust a third-party certification body (such as SGS/TÜV/BSI/China Quality Certification Center CQC) — conduct a carbon footprint assessment for coating products in accordance with ISO 14067; (2) Third-party review of the assessment report + data sources + allocation methods; (3) Upon approval — issue the carbon label certificate — valid for 1–3 years — requires annual renewal (product carbon footprint changes with raw material batches/process modifications); (4) The enterprise uses the carbon label mark on products and packaging. The total cost of carbon label certification is approximately 50,000–150,000 RMB/product/time — for export coatings — the carbon label is an effective tool to enhance green competitiveness.
Q5: How do green electricity (Green Electricity/PPA power purchase agreement) and green certificates (REC) "offset" in coating carbon footprint accounting?Coating factories purchasing green electricity (wind/solar)——Scope 2 (purchased electricity) carbon emissions are counted as zero, product carbon footprint can be reduced by 5%-15% (corresponding to the proportion of carbon emissions in the manufacturing process). But it requires——(1) Proof of "additionality" of green electricity (Additionality/cannot use existing wind/solar——must be newly built green electricity); (2) International recognition of green certificates (REC/I-REC)——RE100/CBAM recognition standards for green certificates are dynamically changing——green electricity carbon offset strategy needs to keep up with the latest international rules.
Q6: How is the "biocarbon" in bio-based coatings (vegetable oil alkyd/soy polyol PU) calculated in the carbon footprint?Biogenic Carbon—CO₂ fixed from the atmosphere by plants through photosynthesis—in product carbon footprint reports—the uptake (negative emissions) and emissions (positive emissions) of biogenic carbon must be reported separately and cannot be directly combined as "zero". For example—the biocarbon uptake of vegetable oil alkyd = -3kgCO₂/kg—but the fossil carbon emissions from synthesis and processing = +5kgCO₂/kgnet carbon footprint = +2kgCO₂/kg (not zero). A "net zero" claim for biogenic carbon can only be verified in the "full life cycle (entire planting-processing-use-disposal)"—a single product carbon footprint cannot claim "carbon neutrality".
Q7: How is "Data Quality Rating" (DQR) scored in carbon footprint accounting? PEF requires a DQR score for each critical data point (>5% of total carbon contribution) — (1) Technical representativeness (TeR / data year vs. target year / 1-5 points) — the newer, the higher the score; (2) Geographical representativeness (GR / data origin vs. target origin) — the closer, the higher; (3) Temporal representativeness (TiR) — same as above. Total DQR score <1.5 (excellent) / 3.0 need to state "high uncertainty" in the report. DQR scoring is the core of the "credibility" of the carbon footprint report; accounting with low DQR may be rejected during review.
Q8: The proportion of a paint factory's "direct emissions" (Scope 1) in the product carbon footprint?Scope 1——the paint factory's natural gas/steam consumption (reactor heating/ovens/hot air)——the resulting carbon emissions are directly released into the atmosphere, accounting for approximately 5-15% of the product carbon footprint. The main sources of Scope 1——(1) resin synthesis reactors (thermal oil heating/>200°C/natural gas); (2) ovens (baking coatings/PMT >200°C); (3) factory HVAC (winter heating). Scope 1 emission reduction——(1) switch to heat pumps (COP>3/3x efficiency——natural gas→heat pump reduces carbon by >50%); (2) heat recovery from RTO regenerative thermal oxidation (>95% efficiency)——recovering the heat from VOC incineration as process heat.
Q9: Why is the "Scope 3 downstream emissions" (product use stage) of coating carbon footprint—typically not counted?Coatings are intermediate products (non-consumer goods)—the carbon emissions during the application and use stages of coatings—(1) solvent volatilization during painting (VOC→CO₂ photochemical conversion—no direct carbon emissions); (2) no carbon emissions during the long-term service of the coating (>20 years) (the coating does not burn)—therefore the difference between the "cradle-to-grave" and "cradle-to-gate" carbon footprint of coating products is extremely small (<5%)The carbon footprint accounting of coatings usually only goes to "cradle-to-gate"This is a special simplification of coating carbon footprint.
Q10: What is the future of coating carbon footprint under CBAM (Carbon Border Adjustment Mechanism) and the EU Green Deal?CBAM currently only covers steel/cement/aluminum/fertilizers/electricity; coatings are not in the initial list. However, the EU is evaluating the inclusion of chemicals (including coatings) in the second phase of CBAM (expected 2028-2030). Coating companies exporting to the EU should — proactively conduct carbon footprint accounting for their products (ISO 14067) — prepare the data foundation for CBAM compliance because once CBAM covers coatings — importers will be required to pay carbon border adjustment fees based on the product's carbon footprint (~60-80 EUR/ton CO₂/2026 carbon price) preparing data in advance can significantly reduce compliance costs and trade risks.
Related Reading
Summary
The four major contribution sources of coating carbon footprint accounting (ISO 14067/PEF) — resin (>35%), titanium dioxide (>25%), zinc powder (>10%), and manufacturing process (<15%). For the emission factors in the Ecoinvent/GaBi databases, attention should be paid to geographic representativeness (prioritize the China CLCD database). Carbon labels (CN mark/UK Carbon Label) are the green passports for export coatings. Kexin New Materials is committed to carbon footprint accounting and carbon label certification of coating products — providing customers with low-carbon coating products and carbon compliance support.