
The term "nano" is used far too casually in the coating market. A bottle of ordinary varnish, with just a little filler added, dares to be labeled "nano-grade"; a ceramic coating casually claims "9H" "superhydrophobic" yet provides no third-party test data. For genuine engineering material selection, nano coating is not established by slogans, but verified by a set of repeatable, citable testing and characterization systems. Whether the particle size truly falls within 1–100 nm, whether the Zeta potential is stable, whether the film thickness is at the nm or µm scale, exactly how many H the pencil hardness is, and what the measured hydrophobic angle is in degrees—all of these must be spoken by instruments, not by copywriting.
This article is aimed at coating engineers, quality inspectors, and procurement technical decision-makers. It systematically reviews the key characterization methods for nano coatings from raw particles to film-forming performance, and provides a comparison table of test items and a horizontal comparison of measured data from different nano coatings. All specific values and standard numbers come from batch research archives (TDS_MSDS_RESEARCH.md), with sources noted, for direct citation into technical agreements and acceptance documents. Amid today's chaotic market terminology, using "testing" as the first filter is the most cost-effective and safest selection strategy.
As a technical supplier of industrial coatings and functional coatings, Kexin New Materials (kexinMaterials) insists on providing key characterization data (particle size distribution, Zeta potential, film thickness, hardness, contact angle, salt spray, etc.) with nano composite coatings upon delivery, and treats "detectable, verifiable" as the basic discipline of product definition. The characterization framework outlined in this article is exactly the checklist of methods we recommend customers to verify item by item during acceptance.
I. Define First: What is "Nano Coating" and Why Testing is the Bottom Line
According to the research archive (§5.1), the definition of nano coating is clear: at least one phase has a dimension in the 1–100 nm range. Common nanoparticles include TiO₂, SiO₂, ZnO, Ag, Cu, CaCO₃, etc. What truly works are three scale effects:
- Small-size effect: Particles are extremely small, and their interaction with light changes, affecting transparency, color, and optical performance;
- Surface effect (high specific surface area): The smaller the particle size, the larger the surface area per unit mass, the more active surface sites, and the stronger the dispersion, adsorption, and reaction capabilities;
- Quantum size effect: At extremely small ranges (typically a few nanometers to over ten nanometers), discrete energy levels appear, affecting electrical, optical, and catalytic behavior.
But the scale effect is a double-edged sword. The research archive also points out that the key challenge of nano coating is agglomeration: nanoparticles have extremely high surface energy and easily attract each other to agglomerate into micron-scale clumps. Once agglomerated, they degenerate into "ordinary fillers" and lose their scale-effect advantages. Therefore, the first priority of testing is to confirm that "nanoparticles truly exist in the system stably dispersed at the nanoscale"—which is exactly the purpose of particle size and Zeta potential measurements.
Regarding the point of "chaotic market terminology, purchase based on third-party test reports," the research archive (§6.6) also gives a clear warning: currently words like "9H" "nano" are abused, and hard data such as film thickness, contact angle, salt spray, and abrasion resistance should be requested when purchasing. Preposing acceptance criteria is far more effective than post-hoc disputes. For how to incorporate "verifiable performance" into decision-making when selecting industrial water-based / high-solid systems, refer to Waterborne Industrial Coating Selection; for more general coating acceptance and testing logic, you may also read Water-based Paint Acceptance Test Key Points.
II. Testing Project Overview: A Practical Characterization Checklist
The table below integrates the testing items, methods, corresponding standards, and interpretation key points of nano coating from "particle raw materials" to "film-forming performance," serving as the skeleton for technical agreements and quality inspection.
| Test Dimension | Characterization Item | Main Method/Instrument | Applicable Standard (per archive) | Interpretation Key Points |
|---|---|---|---|---|
| Particle Scale | Particle Size and Distribution | Dynamic Light Scattering DLS | Research Archive §5.6 | Whether main peak falls within 1–100 nm, whether distribution is narrow |
| Dispersion Stability | Zeta Potential | DLS coupled with electrophoretic light scattering | Research Archive §5.6 | Higher absolute value means more stable, prevents agglomeration |
| Morphology | Particle/Film Morphology | TEM (transmission), SEM (scanning) | Research Archive §5.6 | Whether monodisperse, presence of agglomerates |
| Film Thickness | Dry Film Thickness | Step profiler, ellipsometry, SEM cross-section | Research Archive §5.6, §6.5 | nm–µm scale, record test method |
| Hardness | Pencil/Nanoindentation | Pencil hardness tester (GB/T 6739), nanoindentation | GB/T 6739, ISO 15184 (archive general table) | Note substrate and load; 9H depends on substrate |
| Hydrophobicity | Contact Angle/Rolling Angle | Contact angle meter | Research Archive §5.6, §6.5 | Method (sessile drop), static angle and rolling angle |
| Corrosion Resistance | Neutral Salt Spray | Salt spray chamber | GB/T 1771-2007, ASTM B117, DIN EN ISO 9227 (archive general table) | 500h no blistering / unilateral rust ≤1–2mm; heavy anti-corrosion 1000–3000h |
| Adhesion | Cross-cut | Cross-cut tester | GB/T 9286-1998, ISO 2409, ASTM D3359 (archive general table) | 0–5 grades, 0/1 grade excellent |
| Abrasion Resistance | Taber Abrasion | Taber abraser | GB/T 1768, ASTM D4060 (archive general table) | ≤10–50 mg/1000 rev (depending on grade) |
| Gloss | 60° Gloss | Gloss meter | GB/T 9754, ISO 2813, ASTM D523 (archive general table) | High gloss ≥85 GU |
The core message of this table is: the "nano" attribute of nano coating is proven by the first two rows (particle size, Zeta), and the film-forming performance is proven by the latter rows (film thickness, hardness, contact angle, salt spray, etc.). Neither is dispensable—measuring performance without particle size cannot prove "nano"; measuring particle size without performance cannot prove "useful."

III. Particle Size and Zeta Potential: Proving "Truly Nano and Stable"
3.1 Particle Size Distribution (DLS)
Dynamic Light Scattering (DLS) is the most common and rapid particle size characterization method for nano coating raw materials and dispersions. Its principle: nanoparticles undergo Brownian motion in liquid, scattered light intensity fluctuates over time, the fluctuation rate relates to the particle diffusion coefficient, and further back-calculates the hydrodynamic diameter and distribution width (polydispersity index PDI).
When interpreting, focus on three things:
- Main peak position whether it falls within 1–100 nm (per archive nano definition);
- Distribution width whether it is too broad—too broad means the system contains agglomerated large particles;
- Presence of bimodal/tailing—a clear second peak above 100 nm often indicates agglomeration has occurred.
It should be noted that DLS gives the "hydrodynamic diameter," sensitive to surface adsorption layers and solvation layers; for strongly agglomerated systems or those containing large particle impurities, results may bias toward larger sizes. Therefore, the archive treats TEM/SEM morphology as a necessary supplement to DLS—using "seeing" to cross-verify the "calculated" results.
3.2 Zeta Potential: A Quantitative Indicator of Stability
Zeta potential reflects the surface charge density of particles and is a key criterion for the stability of colloidal dispersion systems. Its physical meaning: the potential difference between the shear plane and the bulk solution when particles move in an electric field. The higher the absolute value, the stronger the electrostatic repulsion between particles, and the less prone to agglomeration and sedimentation.
For nano coating, the value of Zeta potential lies in predicting shelf life and application stability: if the absolute Zeta potential is low (close to 0), the system easily flocculates during storage, dilution, or mixing, resulting in a "blotchy" or gloss-losing finish when sprayed. The research archive lists "Zeta potential (DLS)" as a core item for nano coating characterization (§5.6), precisely because it directly relates to "whether the nanoscale can be maintained."
In engineering, conventional means to increase Zeta potential and suppress agglomeration include: surface modification (e.g., silane coupling agent coating), addition of dispersants, ultrasonic dispersion, etc.—the research archive (§5.1) explicitly lists "surface modification/dispersant/ultrasonication" as the three pathways to solve agglomeration. This also shows: the process focus of nano coating is not on "adding nano powder", but on "keeping the nano powder stably at the nano scale".IV. Morphology Characterization: TEM/SEM to See the Real Dispersion State
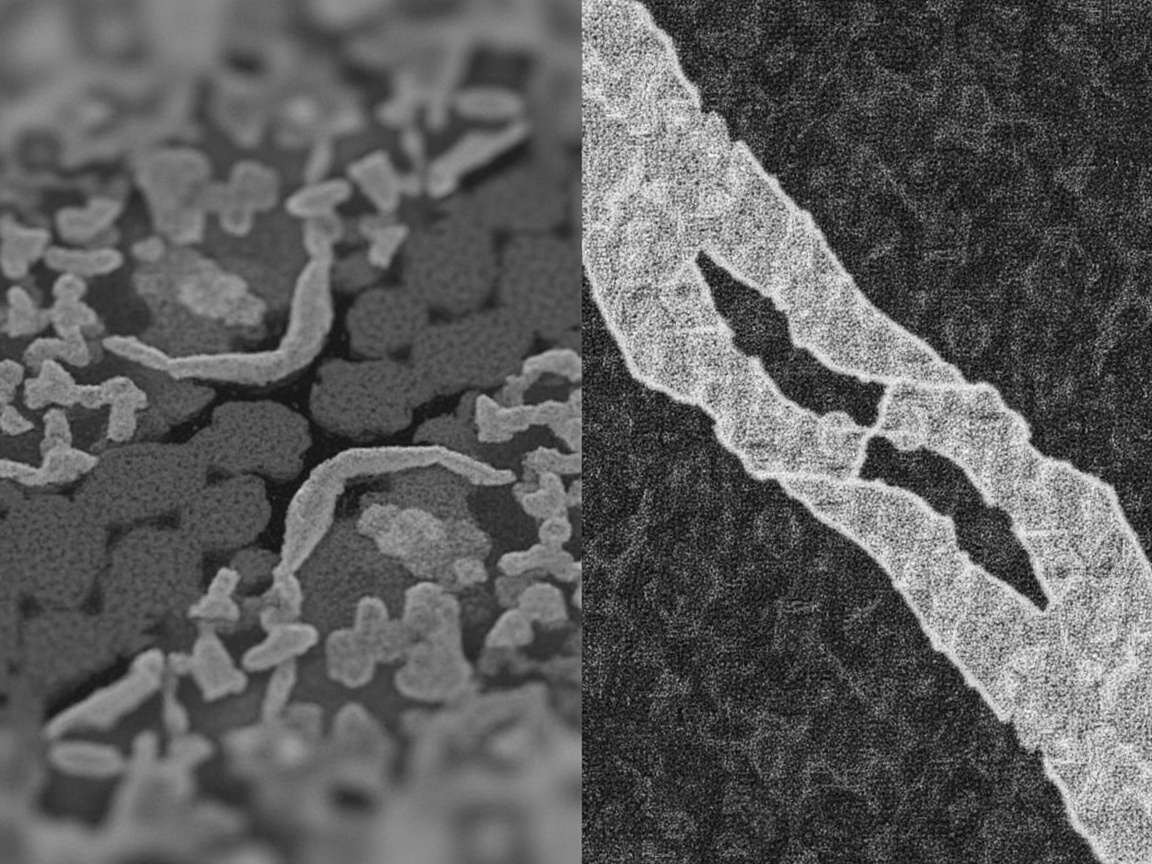
Particle size and Zeta are statistical and indirect quantities; to "see is to believe", one relies on electron microscopy.
- TEM (Transmission Electron Microscope): An electron beam penetrates an ultra-thin sample, with resolution down to atomic level, able to directly observe the shape, size, and agglomeration state of individual nanoparticles. Suitable for verifying whether the average particle size given by DLS is real and whether the particles are monodisperse.
- SEM (Scanning Electron Microscope): An electron beam scans the sample surface, presenting three-dimensional morphology and cross-sectional structure, suitable for observing the distribution of nanoparticles in the paint film, and the orientation and stacking of flakes (e.g., nano clay, micaceous iron oxide).
The research archive (§5.6) lists TEM/SEM morphology as a core item for nano coating characterization. In quality dispute scenarios (e.g., a customer questions "does your paint actually contain nanoparticles?"), a clear TEM photo is worth a thousand words—it simultaneously answers three questions: Do the particles exist? Is the size correct? Are they dispersed or clumped?
V. Film Thickness Characterization: nm or µm, Must Be Stated Clearly
The "film" thickness of nano coating spans a very wide range, and different products differ completely in order of magnitude; therefore, film thickness measurement methods should be selected according to the range:
- Profilometer (step method): A scratch is made on the paint film, and a stylus scans the step height, with precision down to nm level, suitable for thin films (e.g., ceramic coatings of tens to hundreds of nanometers). The research archive (§5.6) explicitly lists "film thickness (profilometer/nm–µm)" as a nano coating characterization method.
- Ellipsometer: Uses the reflection phase change of polarized light on a thin film to invert the thickness; non-contact, extremely high precision, suitable for transparent ultra-thin films.
- SEM cross-section: The paint film cross-section is polished and observed under electron microscopy, allowing simultaneous viewing of thickness and layer structure, suitable for multilayer/composite systems.
- Conventional wet/dry film thickness measurement (magnetic/eddy current, destructive cross-cut): Suitable for µm-level thick films (e.g., 50–100 µm functional coatings), but resolution is insufficient to characterize nano-scale thin layers.
The difference in order of magnitude is quite illustrative. According to the research archive (§6):
- Onyx Nano Shield (Si-based automotive ceramic shield): coating thickness 200–400 nm;
- Re-yingcai automotive paint nano ceramic coating: dry film thickness 80–150 nm;
- Gaamp360 ceramic coating (SiO₂-based): thickness 1–3 µm;
- ECS 1300AG electronic superhydrophobic insulating nano ceramic coating: film thickness 12–25 µm;
- YC-8703 hydrophobic self-cleaning nano composite ceramic coating: spray thickness 50–100 µm (a relatively thick functional coating).
As can be seen, although all are "nano coating/nano coating", the film thickness ranges from 80 nm to 100 µm, a difference of three orders of magnitude. Therefore, any description of "nano coating" that does not specify the film thickness order of magnitude and test method is incomplete—this is also why testing must clearly state "what method was used and what was measured".
VI. Hardness and Hydrophobicity: Two High-Frequency Performance Characterization Indicators
6.1 Pencil Hardness (GB/T 6739)
Pencil hardness is the most frequently cited hardness indicator for coatings, with the standard GB/T 6739 (corresponding to ISO 15184); the archive general table records its grade range as B–H. The test uses a set of calibrated hardness pencil leads to scratch the paint film at a specified angle and load, and the result is expressed as "the hardest pencil that does not scratch".
Measured hardness data of nano coatings/coatings in the research archive include:
- YC-8703 hydrophobic self-cleaning nano composite ceramic coating: hardness 6–7H (according to §5.2);
- Onyx Nano Shield: hardness 9H (pencil hardness, according to §6.1);
- Gaamp360 ceramic coating: hardness 9H (according to §6.2);
- Re-yingcai automotive paint nano ceramic coating: pencil hardness 8H–9H (according to §6.4).
Key interpretation discipline (also repeatedly reminded by the research archive): "9H" is pencil hardness, not equivalent to absolute hardness in materials science, and is strongly dependent on substrate and test conditions. A 9H measured on soft plastic is not comparable to a 9H measured on hardened steel; load, scratch speed, and pencil age all affect the reading. Therefore, when reporting hardness, the substrate, pencil method standard (GB/T 6739), and load/angle must be stated simultaneously. More advanced characterization can use nanoindentation to give quantitative values of elastic modulus and hardness (H), suitable for scientific research and high-end quality assurance.
6.2 Contact Angle and Hydrophobicity
Hydrophobic/self-cleaning performance is evaluated by contact angle (CA) and sliding angle (SA) (according to archive §6.5). A contact angle meter uses the sessile drop method to place a drop of water on the paint film surface and measures the angle between the droplet and the surface: the larger the angle, the more hydrophobic; superhydrophobic is usually >150° with a very small sliding angle; the smaller the angle, the more hydrophilic.
Measured hydrophobic angles in the research archive:
- YC-8703: hydrophobic angle about 110° (according to §5.2);
- Onyx Nano Shield: water contact angle 120° (superhydrophobic), oil contact angle 60°, sliding angle 11–55° (according to §6.1);
- Gaamp360: hydrophobic angle 100–120° (according to §6.2).
Interpretation key points: The test method (sessile drop method), droplet volume, test liquid (deionized water), and ambient temperature and humidity must be stated. For the same coating, using different droplet volumes or different determination algorithms, the contact angle can differ by several to over ten degrees. The archive also reminds that nano TiO₂ photocatalysis produces "photo-induced superhydrophilicity" (§5.3), so the contact angle of coatings with photocatalytic function will change with light exposure—this precisely shows that reporting an isolated "120°" without stating conditions is insufficient as an acceptance basis.

VII. Corrosion Resistance, Adhesion and Abrasion: Bringing "Nano Advantage" to Durability
The ultimate purpose of nano addition is to improve durability, so durability testing cannot be omitted.
7.1 Neutral Salt Spray (GB/T 1771)
According to the archive general table, neutral salt spray is based on GB/T 1771-2007, ASTM B117, DIN EN ISO 9227; usually 500h without blistering, unilateral rust ≤1–2 mm; heavy anti-corrosion can reach 1000–3000h. The idea of nano composite anti-corrosion (§5.5) is to use nano SiO₂/TiO₂/clay flakes to improve shielding, reduce water and oxygen permeability, and composite with epoxy/polyurethane to delay the path of corrosive media.
Salt spray measurements of nano coatings in the research archive: Re-yingcai automotive paint nano ceramic coating neutral salt spray resistance ≥1200 h (according to §6.4). When interpreting, be sure to write: salt spray type (neutral NSS), duration, evaluation standard (blistering/rust width), avoiding empty phrases like "salt spray passed".
7.2 Adhesion (Cross-cut, GB/T 9286)
The cross-cut method is based on GB/T 9286-1998 (ISO 2409, ASTM D3359), grades 0–5, grade 0/1 is excellent (falloff ≤5%). Especially important for nano ceramic coatings: YC-8703 has a bond strength with the substrate > 4 MPa (according to §5.2), ECS 1300AG emphasizes "good adhesion" (according to §6.3); these data should be included in acceptance together with the cross-cut grade.
7.3 Abrasion (Taber, GB/T 1768)
Taber abrasion is based on GB/T 1768 (ASTM D4060); the archive general table gives a typical range of ≤10–50 mg/1000 revolutions (depending on grade). The addition of nano SiO₂ and ceramic phase is usually aimed at improving abrasion resistance; Gaamp360 takes "scratch resistance" as one of its selling points (according to §6.2). The report should clearly state the grinding wheel model, load, revolutions, and weight loss.
VIII. Horizontal Comparison of Measured Data of Different Nano Coatings/Coatings
Summarize the key characterization data of several representative products from the research archive into a table to facilitate the establishment of "order-of-magnitude intuition":
| Product (according to archive) | Type | Film thickness | Hardness | Hydrophobic angle | Salt spray resistance/other key data |
|---|---|---|---|---|---|
| YC-8703 | Hydrophobic self-cleaning nano composite ceramic coating | 50–100 µm | 6–7H | About 110° | Bonding strength >4 MPa; electrical insulation >200 MΩ; temperature resistance -50–400℃ |
| Onyx Nano Shield | Si-based automotive nano ceramic shield | 200–400 nm | 9H | 120° (oil 60°) | rolling angle 11–55°; durability approx. 1 year |
| Gaamp360 | SiO₂-based automotive ceramic coating | 1–3 µm | 9H | 100–120° | durability 2–5 years; temperature resistance up to 600℃ |
| Re-yingcai | inorganic nano ceramic composite | 80–150 nm | 8H–9H | superhydrophobic self-cleaning | neutral salt spray ≥1200 h; temperature resistance -45–180℃ |
| ECS 1300AG | aerogel + nano ceramic (electronics) | 12–25 µm | — | superhydrophobic | electrical insulation, RoHS/REACH/WEEE compliant |
The lesson from this table is: film thickness, hardness, and contact angle must appear as a set to be meaningful. Promoting "9H" alone without giving film thickness and substrate, or claiming "superhydrophobic" without giving the contact angle test method, is incomplete information. Using the above table as an acceptance template and requiring suppliers to fill in the numbers cell by cell with attached test reports can effectively filter out "copywriting-type nano paint".
When translating test data into procurement decisions, it is recommended to consider "verifiable performance" alongside "cost and application". For a related selection framework, refer to Water-based vs. Solvent-based Coating Selection Guide, and use the characterization checklist in this article as the "technical verification" sub-item within it.
Part Eight-One: Sampling and Sample Preparation: The Premise for Credible Test Results
No matter how good the instrument, poor sampling and sample preparation can yield misleading conclusions. Nano systems are especially sensitive to handling; the following four points are often overlooked yet decisive for data integrity as prerequisite steps.
First, representativeness of dispersion sampling. Nano particles tend to agglomerate and settle; after standing, the top may be dilute, the bottom concentrated, or even hard sediment blocks at the bottom. If you casually scoop a spoonful from the surface for DLS, you get a "finer false impression"; sampling from the bottom gives a "coarser false impression". The correct approach is to fully re-disperse using the "ultrasonic dispersion" method mentioned in Archive §5.1 before sampling, and take a well-mixed bulk sample. For batch QC, fixed sampling points (e.g., container middle) and fixed re-dispersion conditions should be specified to ensure cross-comparability.
Second, sample preparation for film thickness cross-section. When using SEM cross-section or profilometer to view thickness, preparation is key: if cross-section polishing causes thermal damage or tailing, it may "thicken" or "thin" the true film; if the profilometer scratch does not cut through to the substrate, only local roughness is measured. It is recommended to cross-verify key products using two independent methods (e.g., profilometer + SEM cross-section) and state the preparation method in the report.
Third, cleanliness of contact angle samples. Contact angle is extremely sensitive to surface contamination—finger oils, residual solvents, and environmental dust can significantly alter readings. The same coating can differ by over ten degrees between a clean and a contaminated surface. Preparation must be done with gloves, the surface cleaned with solvent or plasma, and left to settle for a specified time under constant temperature and humidity before testing; otherwise, "120°" may just be a clean-surface illusion.
Fourth, preparation standards for salt spray panels. Salt spray results highly depend on panel pretreatment and film thickness uniformity. Scratch location, scribe depth, and edge sealing all influence corrosion initiation; uneven film thickness means weak spots fail first. Prepare strictly per GB/T 1771 (blasting/abrasion grade, film thickness control, scribing standard), and state panel condition in the report to avoid misreading "preparation defects" as "product not corrosion-resistant".
Writing sampling and preparation into the test SOP is the premise for making all numbers comparable and traceable—without a unified "how to sample, how to prepare", cross-batch and cross-lab data lose their basis for dialogue.
Part Eight-Two: Common Testing Pitfalls and "Data Packaging" Identification
Market terminology is chaotic (Archive §6.6 already warned of "9H" and "nano" abuse), which manifests in testing as various "data packaging". Procurement and QC personnel must learn to identify the following typical tactics:
- Only giving main peak, not distribution: promoting "particle size 20 nm" while hiding a very broad PDI or a clear second peak above 100 nm. A complete report should give average diameter, distribution width, and whether there is an agglomeration peak.
- Using different test methods to manufacture high values: measuring hardness under smaller load to get higher H; choosing the most favorable droplet volume and algorithm for contact angle. The countermeasure is to require stated standards and method parameters; data from different methods cannot be directly compared.
- Not stating substrate hardness: promoting "9H" measured on a soft substrate as absolute hardness. A standard report must state the substrate (steel/glass/plastic) and GB/T 6739 conditions.
- Using initial contact angle to hide light-induced changes: coatings with nano TiO₂ become photo-induced superhydrophilic under light (Archive §5.3); initial 120° may drop to tens of degrees after a few hours. Not disclosing test timing is selective presentation.
- Applying lab thin-layer data to thick-film products: achieving excellent data on an 80 nm ceramic layer on a substrate, but applying it to a 50 µm functional coating. Different film thicknesses may mean entirely different mechanisms and properties; numbers must be reported per actual product film thickness.
The only unified principle to identify these tactics: require the complete "method + condition + substrate + third-party report" four-piece set. Missing any one, the number is just marketing material, not engineering evidence. This is also why we insist on attaching complete characterization data upon delivery—so every number the customer receives can be traced to a specific standard and a repeatable measurement.
Nine: Characterization and Acceptance Recommendations for Kexin New Materials
Returning to engineering implementation, Kexin New Materials (kexinMaterials) recommends splitting nano paint acceptance into "two-tier evidence":
- Tier 1 (nano attribute evidence): particle size distribution (DLS, main peak 1–100 nm) + Zeta potential (stability) + TEM/SEM morphology (no significant agglomeration). Only with all three can "nano" be confirmed as genuine.
- Tier 2 (performance evidence): film thickness (state method) + hardness (GB/T 6739, state substrate) + contact angle (sessile drop, state conditions) + salt spray/adhesion/abrasion (corresponding national standards). Corresponds one-to-one with the table in Section Eight of this article; missing items are suspect.
For buyers, the safest approach is: write the above test items, standards, pass thresholds, and third-party report requirements into the contract, and conduct batch-by-batch incoming inspection of key items (at least particle size, film thickness, hardness, contact angle). For R&D, continuously monitor dispersion stability with DLS and Zeta during formulation iteration, treating "no agglomeration" as a process red line—after all, the value of nano paint lies entirely in the stable existence of that 1–100 nm.
Kexin New Materials (kexinMaterials) always believes: nano is not a marketing word, but a set of physical quantities that can be repeatedly measured by instruments. When a technical document can clearly answer "what particle size, what Zeta, what film thickness, what hardness, what contact angle, what salt spray", the so-called "nano paint" truly deserves the name.
It should be added that characterization is not "one test for life". Nano dispersion systems are sensitive to temperature, storage time, and shear history; batch-to-batch Zeta potential drift or slight agglomeration may occur. Therefore, it is recommended to include key items (particle size, Zeta, film thickness, hardness, contact angle) in a batch-by-batch incoming inspection + periodic type inspection dual-track: incoming inspection confirms the batch is usable, type inspection (e.g., salt spray, abrasion) verifies long-term stability. Only by making testing a continuous action rather than a one-time pass can nano paint's performance promises withstand repeated field tests.
Ten: Frequently Asked Questions
Q: Why must nano paint testing include particle size and Zeta potential?
A: Because the definition of "nano" is at least one phase dimension 1–100 nm (per research archive §5.1). Measuring only film-forming performance cannot prove particles are truly at nano scale; and nano particles agglomerate easily (archive §5.1), while Zeta potential quantifies dispersion stability. Together they prove "nano and stable", the fundamental evidence distinguishing nano paint from ordinary filler paint.
Q: DLS particle size and TEM particle size disagree—which is authoritative?
A: DLS gives "hydrodynamic diameter", including solvation layer, sensitive to large particles/agglomerates; TEM is direct observation of true morphological size. The two should corroborate: if DLS main peak is significantly larger than TEM, it often indicates agglomeration. The archive lists TEM/SEM morphology as a necessary supplement to DLS (§5.6); it is recommended to calibrate scale with TEM and monitor batch stability with DLS.
Q: Does pencil 9H mean the coating is very hard?
A: 9H is a grade in GB/T 6739 pencil hardness method, not equal to absolute material hardness, and strongly depends on substrate and test conditions (load, angle, pencil state). In the archive, Onyx, Gaamp360 etc. are labeled 9H (§6.1, §6.2), but all measured on specific substrates. Reports must state substrate and standard, otherwise the number has limited reference value; if necessary, use nanoindentation to give quantitative modulus and hardness.
Q: Is contact angle 120° definitely "superhydrophobic"?
A: Not necessarily. Superhydrophobicity usually requires a contact angle >150° and a very small rolling angle. 120° is highly hydrophobic rather than strictly superhydrophobic (e.g., Onyx water contact angle 120°, per §6.1). Moreover, the contact angle is affected by test method, droplet volume, temperature and humidity, so the sessile drop method and conditions must be stated; coatings with photocatalysis (e.g., nano TiO₂) also become hydrophilic under light (§5.3), so reporting an isolated value is meaningless.Q: Why does the film thickness of nano coating vary so much, from 80 nm to 100 µm?
A: Different nano coatings have different functions and morphologies: automotive ceramic shield is as thin as 80–150 nm (Re-yingcai, §6.4), 200–400 nm (Onyx, §6.1); SiO₂-based ceramic coating 1–3 µm (Gaamp360, §6.2); electronic insulating coating 12–25 µm (ECS 1300AG, §6.3); functional composite ceramic can reach 50–100 µm (YC-8703, §5.2). The film thickness order determines the test method and must be specified.
Q: How should neutral salt spray 500h and 1000–3000h be interpreted?
A: According to the general table of the archive, neutral salt spray (GB/T 1771, etc.) typically shows no blistering and single-side rust ≤1–2 mm at 500h; heavy anti-corrosion can reach 1000–3000h. Nano composite anti-corrosion relies on lamellar structures to reduce water and oxygen permeation (§5.5). Re-yingcai measured neutral salt spray ≥1200 h (§6.4). Interpretation must state the salt spray type, duration and rating standard; writing only "salt spray passed" is not acceptable.
Q: What is the difference between cross-cut adhesion grade 0 and grade 1?
A: Cross-cut method (GB/T 9286) grades 0–5, with 0/1 as excellent,脱落 ≤5% (general table of archive). Grade 0 shows essentially no loss, grade 1 shows slight edge loss but still excellent. For nano ceramic coatings, bond strength (e.g., YC-8703 >4 MPa, §5.2) should also be considered comprehensively, because a brittle ceramic layer may perform well in cross-cut but poorly in impact resistance.
Q: Is it sufficient to just ask the supplier for a "nano test report"?
A: No. The report should cover the full chain of secondary evidence in this article: particle size + Zeta + TEM (nano attributes), film thickness + hardness + contact angle + salt spray/adhesion/abrasion resistance (performance), with standards and methods stated. Archive §6.6 also warns of confusing market terminology; when selecting, look at third-party test reports, film thickness, contact angle, salt spray/abrasion data—any missing item is questionable.
Q: How should the abrasion resistance of nano coating be tested to be credible?
A: Use Taber abrasion (GB/T 1768, ASTM D4060, general table of archive ≤10–50 mg/1000 rev as grade), and clearly state the wheel model, load, revolutions and weight loss. Nano SiO₂/ceramic phase aims to improve abrasion resistance, but the report must give specific weight loss rather than qualitative descriptions like "good abrasion resistance" to allow cross-comparison of different products.
11. Further Reading
- Key Points for Water-based Paint Acceptance Testing (same cluster: coating testing and acceptance methods, complementary to the characterization framework of this article)
- Selection of Water-based Industrial Coatings (same cluster: performance verification and selection of industrial coating systems)
- Water-based vs. Solvent-based Coating Selection Guide (related: treating "verifiable performance" as a selection dimension alongside cost and application)